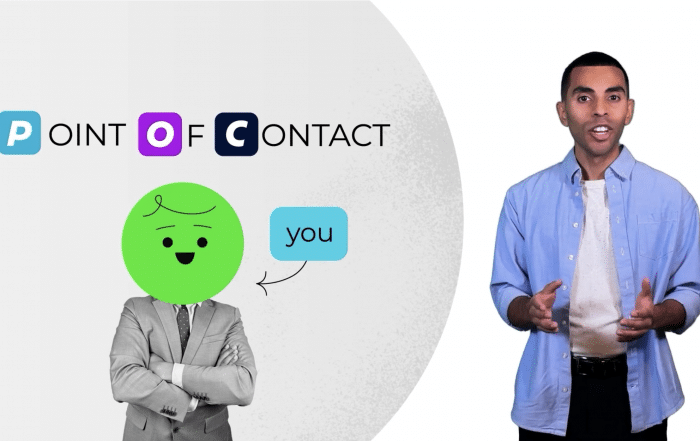
We’ve decided to write about learning how to make an infographic for one simple reason:
The human brain is wired to process information visually.
So much so, that studies have concluded up to “90% of the information transmitted to the human brain is visual.” The effect? Your audience is significantly more likely to discover, process, and act upon the information you’re sharing.
Social media companies like Facebook know this well, and it’s why they prioritize highly visual content. This, combined with the fact that digital marketing in the 2020’s is all about trust, value and education — is why understanding how to make an infographic is essential.
Why Use Infographics?
Infographics are effective because they use illustrated graphics to compliment concise writing. When humans process language and visual information simultaneously, it’s much easier to grasp the main points.
The data supports the use of infographics. High quality infographics are a whopping 30 times more likely to be read than a simple text article, and on average, they are liked and shared at tremendously high rates.
Beyond just attracting viewers, they are effective because there are so many ways to use them. An infographic can be a story. It can present a historical timeline. It can utilize symbols and metaphors. It can help illustrate complex data.
And creating an artistically beautiful infographic can entice customers to learn more about your brand.
In this article, we’ll give you the information you need to get started on a fantastic infographic for your company. We will explore different types of infographics, we’ll discuss how to make an infographic, and we’ll dive into infographic marketing.
Choosing the Right Type of Infographic
Most infographics can be divided into three categories: static infographics, animated infographics, and interactive infographics. Each have different strengths and weaknesses. Let’s learn about them!
Static Infographics
Static infographics are the most common type of infographic. They are unmoving and don’t require user input of any kind. Generally, these types of infographics are straightforward, elegant, and reveal information in a super clear way.
Since these infographics aren’t motion-based, designers have lots of room to focus on making them artistically beautiful. Static infographic design requires comparatively little technical experience, and they are the most affordable type of infographic to create. Additionally, are most familiar with this style of infographic.

In fairness, static infographics also come with some weaknesses.
They are less dynamic than other forms of infographics, so they don’t earn attention at the same rates. Likewise, when marketing farms pump out cookie cutter infographics, they often look too generic, and fail to hold a consumer’s interest. (Sorry, Canva!).
The skill sets necessary to create a static infographic include graphic design, professional writing, and message/target market research.
Animated Infographics
The defining feature of animated infographics is that they are, well, animated! Usually, they move on a loop, much to a GIF. However, like a static infographic (and unlike interactive infographics) a user can’t click or interact with any part of the piece.
The biggest strength of animated infographics are their ability to hold the attention of a consumer. Moving parts attract the eye much more effectively than static images do. They also will help users form an emotional connection with your content.
 Weaknesses of animated infographics include potential information overload (if the infographic is designed too noisily) and computer loading issues (if the infographic eats up too much memory and the viewer doesn’t have the necessary bandwidth).
Animated infographics also necessitate broader skill sets than static infographics do. Most notably, they require an animator! Assuming the infographic is more than a simple animated graphic, a researcher and writer is also important to ensure overall quality, much like a static infographic.
Interactive Infographics
Interactive infographics are infographics that allow a user to have a “hands on experience” with the content. A great example of this are election maps.- often used during political campaigns. These tools allow visitors to make choices about where to go, what to explore, or what information to reveal. By hovering clicking on certain elements within the interactive infographic — or in some cases, simply hovering one’s mouse over — novel information or experience will be revealed.
The ability for a consumer to literally interact with the content is a major advantage of this type of infographic. Consumers are far more likely to process information when they have they are brought into the learning process.
But like animated infographics, if interactive infographics are built with too many bells and whistles, the most important information can get lost in a sea of activity. It is therefor crucial to make sure that interactive components are only built in service of the message itself.
Finally, these are the most expensive types of infographic — as they require multiple levels of professional experience. A graphic designer, writer, researcher, animator, and web developer are usually all necessary to create this type of infographic.
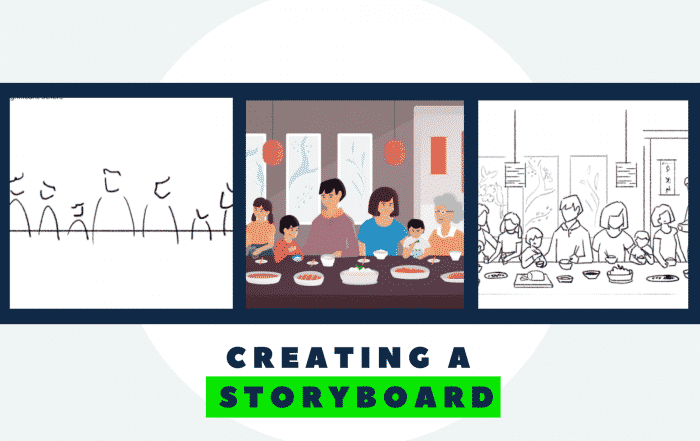
How to Make an Infographic
Creating a great infographic is a serious time investment, but the rewards of creating a professional, high end brand are worth it.
Besides the short term research, copywriting, and design skills it takes to create a fantastic communication piece, understanding your company’s longer term marketing goals (including where the infographic fits into those goals) is essential.
And while it’s true that learning how to make an infographic for the very first time can be a major time investment, by getting consumers interested in your brand with engaging content, the benefits will outweigh the costs over the long run. By a wide margin!
Here’s how to make an infographic.
Step 1: Assemble Your Team
One of the most important steps in making an infographic is deciding what kind of talent you need around you. This decision can be better made once you understand your audience, the type of infographic you’re committing to, and the goals of the infographic.
Identifying and understanding your audience is absolutely vital. Once the target audience is understood, you’ll be able to better define the infographic’s goals. This step will provide insight into which skill sets you need on your team.
Let’s explore some examples.
Imagine you work for a college prep company, and you wish to create infographics that drive traffic to your website, from several target audiences.
- If your infographic is on the subject of “how to apply to art school,” you’ll need to ensure that the graphic design is excellent — since the target audience is filled with budding, visual artists. In this case, you’ll only need a writer and a graphic designer or illustrator.
- If you want to build a broader, traffic-seeking piece, you might create an interactive infographic called, “a History of HigherEd in the United States.” Perhaps your users will be able to toggle through a timeline of decades, revealing novel information as they progress. In this case, you’ll need a writer, a designer, and a talented developer.
- If you want to create a visual representation of the colleges with the best job placement rates compared to overall cost, you might consider an animated infographic, which plott results along an X-Y axis. In this case, you may not need a writer, but you’ll certainly need a designer, and either a developer or an animator, depending on the approach you take.
Each team will be different based on the target audience of the infographic, as well as the available talent and skill you already have access to. Then again, you can always work with a talented creative agency.
Step 2: Research, Plan, and Visualize
Once your team is assembled, the next step is to dive into the information, and decide exactly what content you want to display on the infographic.
Remember the goals of infographics: they aren’t about stuffing in as much information as possible — they are about simplifying a concept to its core elements. So get together with your team and ask questions like:
– What are the most important takeaways we want our audience to understand?
– What information is essential to the story, versus simply interesting?
– If I knew nothing about our topic, what are the big questions I would need the answers to?
After coming up with the basic outline of the important information you want to convey in your infographic, the next step is to plan out how you want to showcase it.
Do you want to have five main points with a few offshoots for secondary information? Or instead, do you want two main ideas with a few sub-points under each idea?
There are countless ways to skin the infographic cat, and there’s never a “right” answer — just better, and worse fitting ones! The best thing you can do is work to understand your target audience and your overall goals. Personalize your message as closely to your target audience as you can. Information will resonate better if it’s tailored to them.
Once the general flow of ideas is decided , it’s time to visualize how this information is going to look in the actual infographic.
Think in general terms to start. Do you want a circular infographic with information stemming from a center point? Or maybe a sequential visualization of the infographic, with a clearly defined left to right reading is more appropriate.
Step 3: Designing and Produce Your Infographic
The actual design and creation of the infographic are the final steps. Your writer and illustrator/designer can use examples across the internet for inspiration, or decide to create something totally new. Either way, every choice you make should keep the target audience and main objectives in mind.
This is the time to give your graphic designer some artistic freedom. Encourage them to be creative, eye-catching, and unique. If you can get consumers to look at your infographic simply because it’s a cool design, that’s a major win. Your content and ideas will circulate far more than if they were in a text-heavy article.
Your designers will likely need to use software like Adobe Illustrator or Adobe Spark to make the magic happen. If you have all the team members you need within your organization, excellent!
Otherwise, your best move will be to contact a trusted digital marketing agency, or identify a talented freelancer.
If you’re on a shoestring budget, there are simpler tools available that the layperson can use — like Canva. Tools like these are excellent for small businesses and nonprofits, but beware, you’ll certainly sacrifice some quality and efficacy, compared to professional infographic designs.
Marketing your Infographic
Educational materials like infographics are vital in the modern marketplace. They help build trust, credibility, and loyalty to a brand or product. They also help create a connection between a consumer and a brand. Most importantly, they are very shareable. People are more inclined to share aesthetically pleasing content on social media, which means free word-of-mouth marketing for your organization.
When utilized correctly, infographics will keep your brand “top of mind” with potential consumers.
Infographics are often found on web pages and blog posts, but they can be used in many situations. Social media, email campaigns, and hard copy marketing materials like flyers or brochures all benefit from the use of infographics.
Conclusion: How to Make an Infographic (2021 Guide)
Creating your own infographics requires talented team members, but the benefits for your brand can be enormous. Additionally, the act of creating an infographic can help you keep in mind your target market and long term goals as a company.
If you believe your brand could benefit from professional infographics, reach out to the Motif Motion team and we’ll be glad to help.